
Best Time of Year to Buy
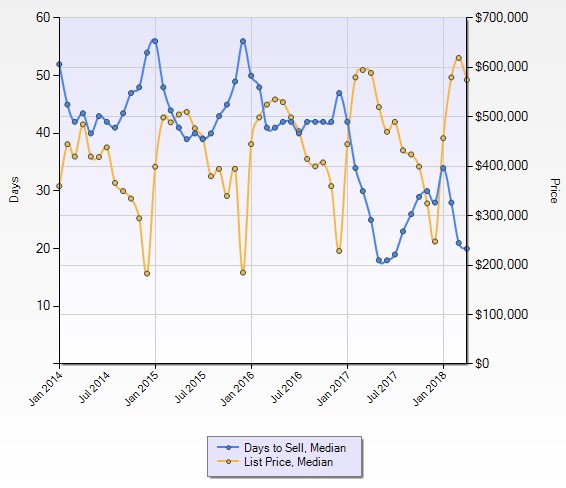
Look at the orange line on the graph… that’s the fluctuation in price. The data is for Southern California from 2014-2018. EVERY year, there’s a dramatic dip during the holidays.
If you can wait at least until October, do it!
Let me know if you want an updated graph each month, no charge :).
XOXO,
Julia


